How do you actually do it? My textbook has questions on it, but it never actually explains it. The solutions manual isn't much help either.
E.g. f(x)=3log10(8x+10) ?
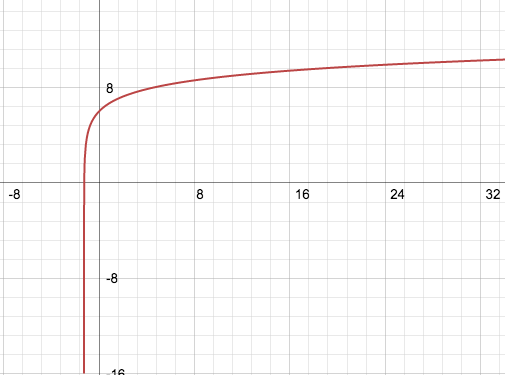
The
general log graph is shown below:

As you can see, the graph with the general rule of logs will never pass x=0, that is, it will always be greater than x=0. This is because if you want to work out the value of
)
, you won't be able to, because it's undefined! Same goes with any number below 0,
)
is also undefined, so evidently on the graph above, the graph will always be on the positive x-axis side.
Now transformations can be treated as usual transformations with other graphs. Here is a run down:
-
 = alog_e(x))
: There is a
dilation by a factor of 'a' from the x-axis, or parallel to the y-axis. The 'a' can be any real number, and this will basically just stretch the grah vertically upwards, much like towards the y-axis, hence the 'parallel' to the y-axis.
-
 = log_e(ax))
: There is a
dilation by a factor of \frac{1}{a} from the y-axis, or parallel to the x-axis. This basically compresses the graph horizontally, towards the x-axis and away from the y-axis.
- f(x) = log_e(x) + b: There is a
horizontal translation of 'b' units in the positive direction of the y-axis. Leave the graph exactly as it is, but literally just move it upwards by 'b' units. This does not affect the overall shape of the curve, that is, it is only a simple shift upwards of downwards.
- f(x) = log_e(x-c): There is a
vertical translation of 'c' units in the positive direction of the x-axis. It is like shifting the graph by 'c' units along the x-axis. This translation also does not affect the overall shape of the curve. The asymptote of the graph is always the horizontal translation too! So in this case, the asymptote is 'c'.
Putting it together:
Let us work with your example:
 = 3log_e(10(8x+10)))
 = 3log_e(80(x+5/4)))
Now you should usually go with the transformations in order of Dilations, Reflections and Translations, you don't have to, but it helps me and it works well.
Dilations: There is a 3 at the front of the function, so by looking above at my examples, if there is a number infront of the whole function, it would be a dilation by a factor of 3 FROM the x-axis.
There is also a number in front of the x inside the log, and inside the brackets, which is 80. From looking above, if we have a dilation in front of the x coordinate itself, it's a dilation by factor

FROM the y-axis.
Reflections: There are no reflections in the example you provided.
Translations: There is definitely a horizontal translation, so we translate the graph, or 'shift' it by 5/4 units in the negative direction of the x-axis. The new asymptote will also become -5\4. Note that this value is negative, so we have shifted our graph in the negative direction of the x-axis!
Now finally, sketch it!
I used to be in the same boat as you, but after countless sketches, it finally made sense, so keep practicing!
Hope that helped a little bit

