Login

Welcome, Guest. Please login or register.

January 01, 2026, 01:00:11 pm

Author Topic: How to use Graph Program  (Read 779 times)  Share 

0 Members and 1 Guest are viewing this topic.

cara.mel

  • Guest
How to use Graph Program
« on: August 25, 2008, 08:18:59 pm »
0
I don't own Microsoft Office because I don't know how to buy it so I have Open office

I have 5 columns I want to plot, first one is x axis and the other four are values

I can change the Y axis (eg scale, how many points displayed) but on the X axis I cannot find this option, it wants to display all 200 points on the axis and I cannot find the option like the Y axis option to change it
so where is it?

I tried to ask people on IRC who did not respond. The graph in question I will just turn off the Axis then Hand Write the X axis numbers on but in the future I would like to know how I can make my X axis like the Y one.
Thank you for your time <3

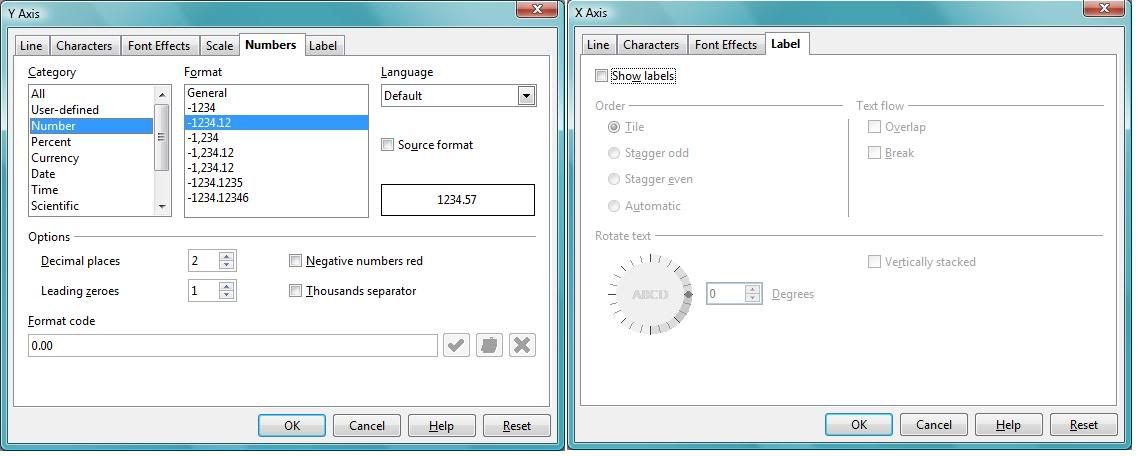
Here is a screen shot, as you can see I am missing some of the options for the X Axis

And what it looks like if I do not turn the X axis label off:

excal

  • VN Security
  • Victorian
  • ATAR Notes Legend
  • *******
  • Posts: 3490
  • Über-Geek
  • Respect: +21
Re: How to use Graph Program
« Reply #1 on: August 26, 2008, 01:56:57 am »
0
http://www.itsnotcheating.com.au - Office 2007 Ultimate for $75

What's in the Scale tab? I'm not familiar with OpenOffice, unfortunately.
excal (VCE 05/06) BBIS(IBL) GradCertSc(Statistics) MBBS(Hons) GCertClinUS -- current Master of Medicine candidate
Former Global Moderator

cara.mel

  • Guest
Re: How to use Graph Program
« Reply #2 on: August 26, 2008, 07:26:00 am »
0
Scale tab is the one that adjusts the scale, I probably should have selected that one for the picture :P