You can associate the gradient graph with the derivative of the function, but most times you won't be given the function, just the curve. Now there are a few key things to note. What happens to the gradient when we have a stationary point on our function graph? The graph will have a horizontal tangent, that is the gradient of the curve is zero. So at these values of

, if we were to plot the gradient graph, we'd have
intercepts. Now the second key information is the sign of the gradient on either side of these stationary point. If the gradient to the left is positive, then the gradient function should be above the
axis for these values of
. And likewise, if the gradient is negative, then the gradient function should be below the
axis for those values of
.
So lets take something like the function drawn below.
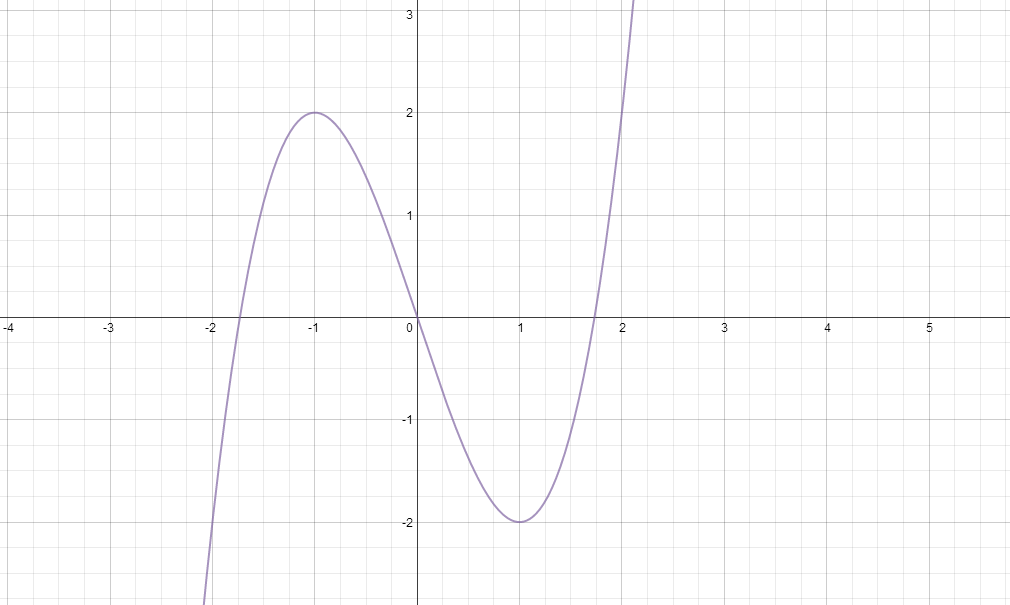
Now we first note the stationary points at

and

, so we know that we have
intercepts on our gradient function at
and
. That is
=0)
when

Now lets look at the sign of the gradient to the left of the first turning point, the gradient is positive, so our gradient function must be positive for

. That is
>0)
for
Now the sign of the function between the two stationary points is negative, so the gradient function will be below the
axis.
<0)
for

Finally we look at the gradient to the right of the last stationary point, the gradient is positive, so the gradient function will be above the
axis. That is
for

This will result in the curve below.
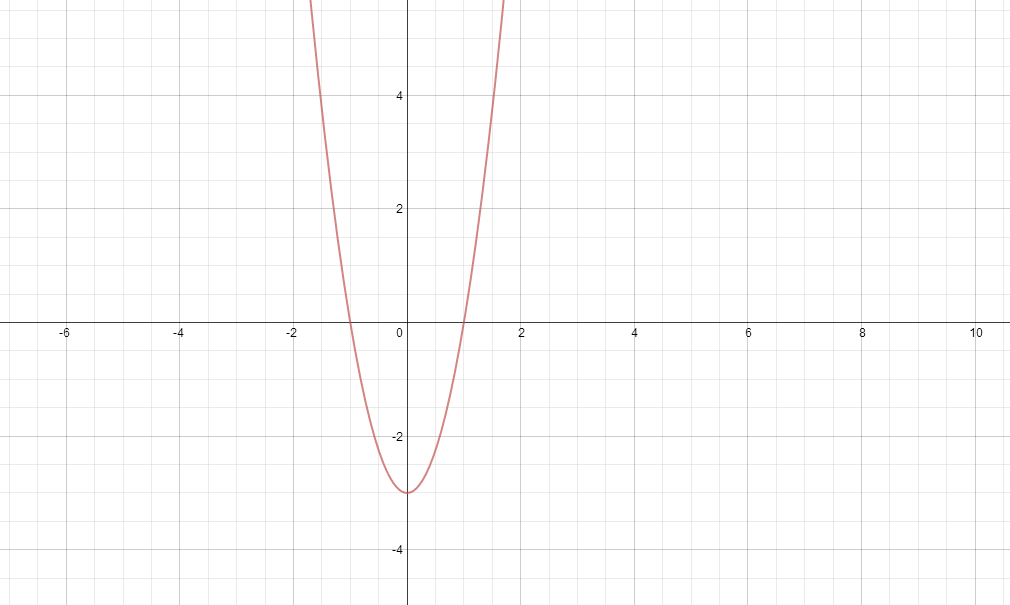
As a tip, I'd find it useful to draw vertical lines through any turning points of the original graph, so that I could see where my
intercepts would be, and section the rest of the graph off into regions of positive or negative slope and work from there.
Anyways, hope that helps

